Prometheus Cluster Metrics
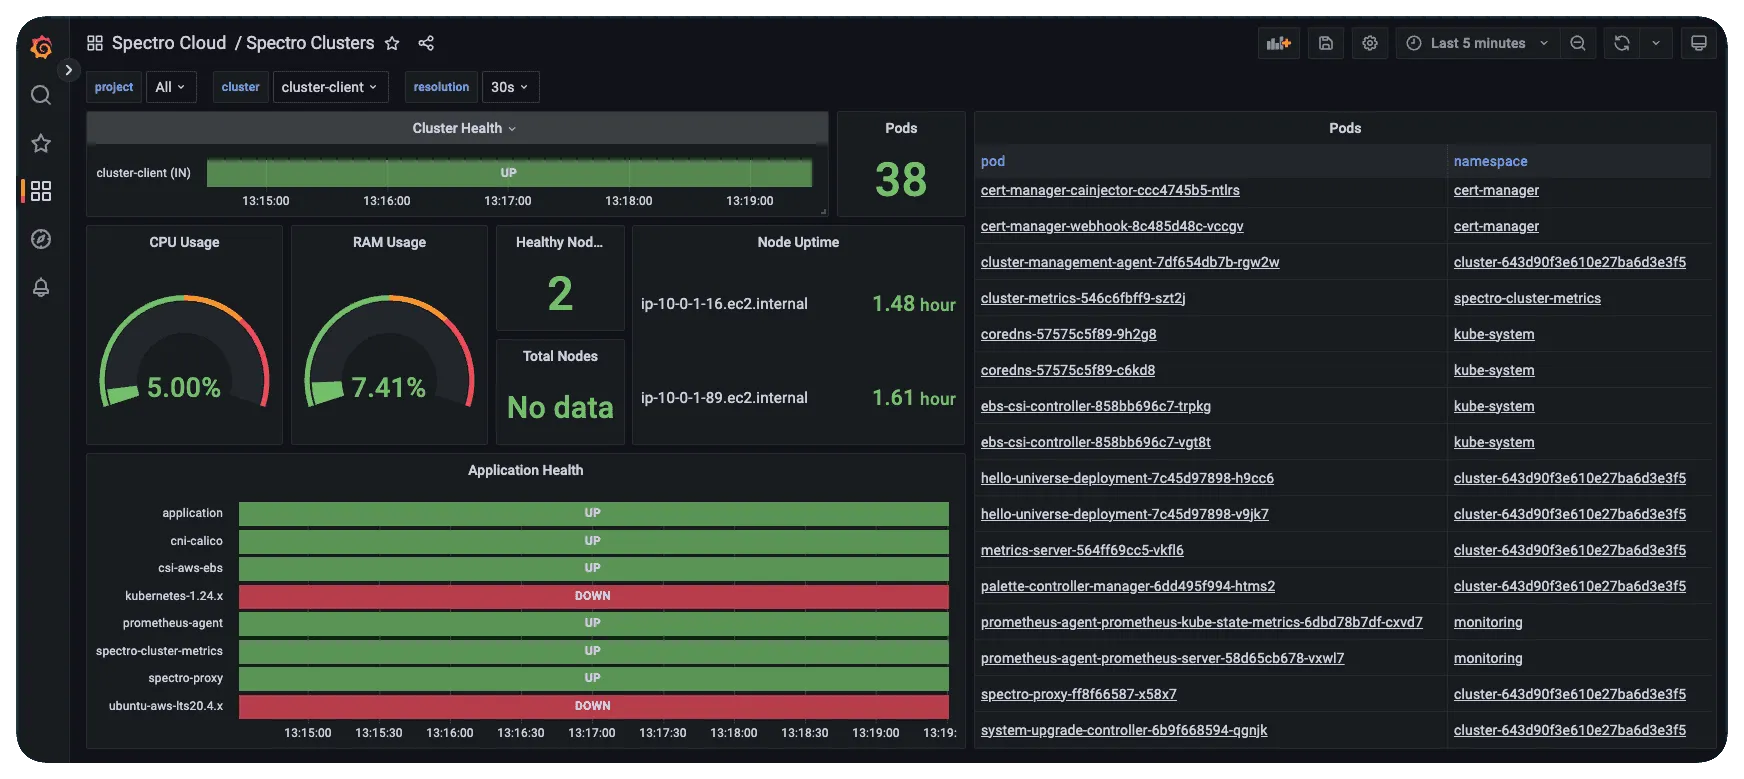
The Prometheus Cluster Metrics is an addon pack that exposes internal cluster resource metrics. You can access the information exposed by the pack in Grafana by visiting the Spectro Cloud / Spectro Clusters dashboard. The following information is exposed by the Prometheus Cluster Metrics pack.
-
Status of all cluster profile layers.
-
CPU and Memory usage of the cluster and all the pods in the cluster.
-
Cluster health status.
-
The cluster's node health status and uptime.
Versions Supported
3.3.X
Prerequisites
-
A host cluster that has the Prometheus Operator pack
v45.4.Xor greater installed. Check out the Deploy Monitoring Stack for instructions on how to deploy a monitoring stack. -
A cluster profile with the Prometheus Agent pack
v19.0.Xor greater installed.
Usage
The Prometheus Cluster Metrics requires no additional configuration and is designed to work out-of-the-box.
You can learn how to add the Prometheus Cluster Metrics to your cluster by following the steps outlined in the Enable Monitoring on Host Cluster.
Pods without the defined attributes request and limit will display no metrics data in the Grafana out-of-the-box
Kubernetes Pods dashboard.
Terraform
data "spectrocloud_registry" "public_registry" {
  name = "Public Repo"
}

data "spectrocloud_pack_simple" "cluster-metrics" {
  name    = "spectro-cluster-metrics"
  version = "3.3.0"
  type = "helm"
  registry_uid = data.spectrocloud_registry.public_registry.id
}