Prometheus Operator
Prometheus is an open-source monitoring system that is designed to collect and analyze metrics from various sources, such as applications, servers, and networks. It is widely used in the DevOps world to monitor the health and performance of applications and infrastructure. Prometheus stores metrics in a time-series database and provides a query language for analyzing the data. It also includes a powerful alerting system that can notify operators when thresholds are breached.
The Prometheus Operator is a tool that simplifies the deployment and management of Prometheus in a Kubernetes cluster. It automates tasks such as configuring Prometheus, creating and managing Prometheus rules and alerts and scaling Prometheus instances based on demand. The Operator uses Kubernetes custom resources to define and manage Prometheus instances and related resources, such as ServiceMonitors, which enable Prometheus to discover and monitor services running in the cluster.
You can use the Prometheus Operator to create a monitoring stack that other host clusters point to and forward metrics to. Check out the guide Deploy Monitoring Stack to learn how to create a monitoring stack with Prometheus for your Palette environment.
We recommend you use version v44.3.x or greater moving forward for a simplified and improved user experience when creating a monitoring stack for your architecture. Starting with version v44.3.x the remote monitoring feature is supported. Check out the Prometheus Remote Write Tuning to learn more about the remote monitoring feature.
Versions Supported
- 51.0.x
- 46.4.x
- 45.25.x
- 45.4.x
- 44.3.x
- 40.0.x
- 37.0.x
- 35.5.x
- 30.2.x
- Deprecated
Prerequisites
-
Kubernetes v1.16 or greater.
-
The minimum required size for the Prometheus server is 4 CPU, 8 GB Memory, and 10 GB Storage. We recommend the monitoring stack have 1.5x to 2x the minimum required size:
Recommended size:
- 8 CPU
- 16 GB Memory
- 20 GB Storage
As new clusters with the Prometheus agent are added to your environment, review the resource utilization and consider increasing resources if needed. As the Prometheus documentation recommends, each additional agent requires the following resources from the monitoring stack:
Each added agent:
- 0.1 CPU
- 250 MiB Memory
- 1 GB Storage
Refer to the Prometheus Operational aspects documentation for additional guidance.
Parameters
The Prometheus operator supports all the parameters exposed by the kube-prometheus-stack Helm Chart. Refer to the kube-prometheus-stack documentation for details.
The Prometheus Operator pack has one parameter you must initialize grafana.adminPassword:
charts:
  kube-prometheus-stack:
    grafana:
      adminPassword: ""
Use the grafana.adminPassword parameter to assign a password to the Grafana admin user admin.
Additional parameters you should be aware of can be found by expanding the Presets options. You can modify the preset settings when you create the profile or when you deploy the cluster and review the cluster profile.
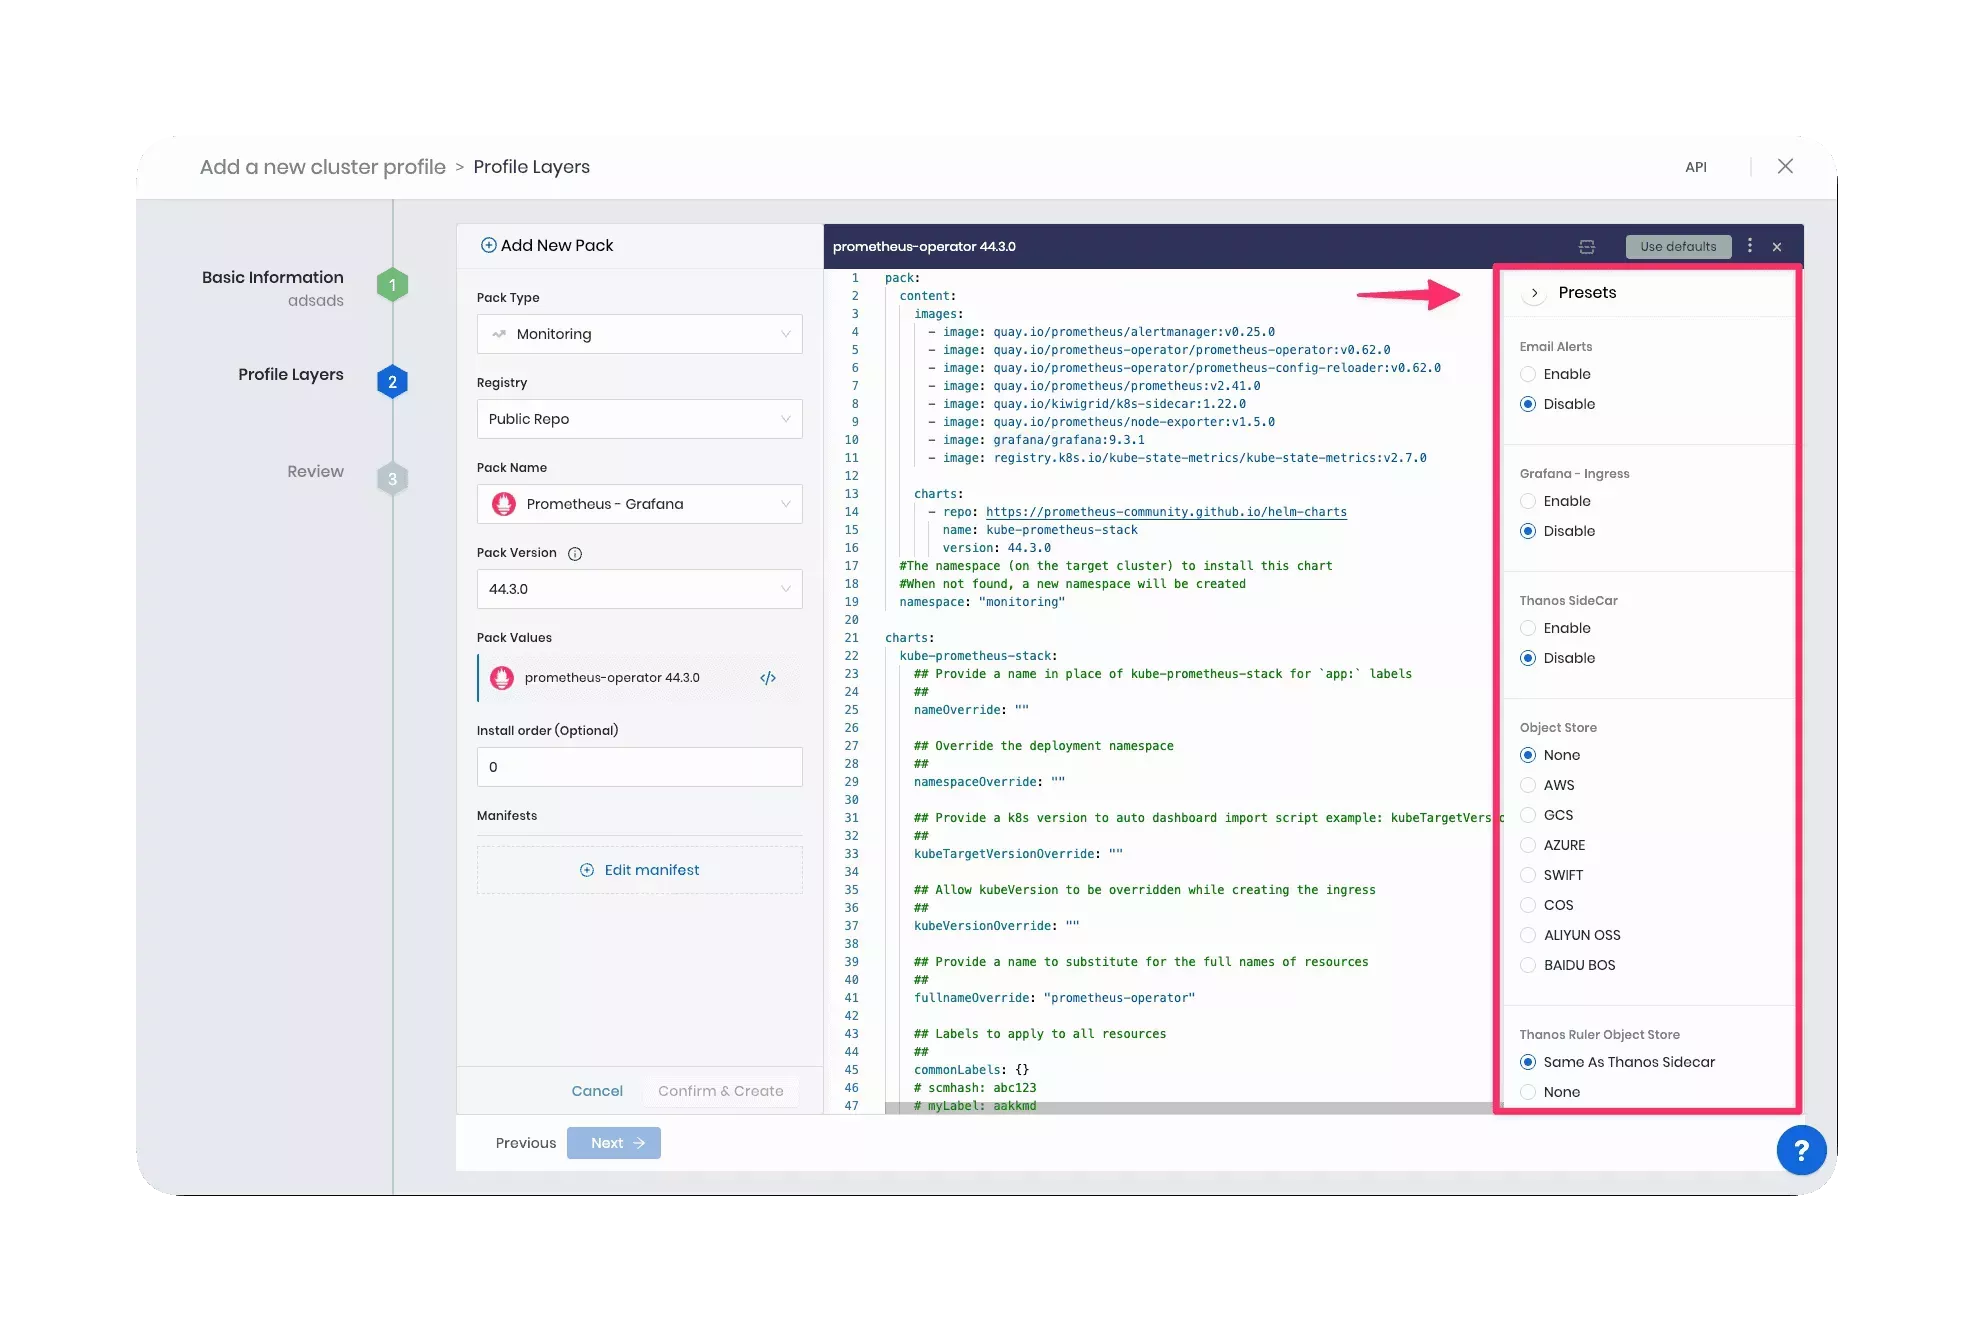
Review the usage section below to learn more about each preset option.
Usage
Check out the guide Deploy Monitoring Stack to learn how to create a monitoring stack with Prometheus for your Palette environment.
Airgap Palette and VerteX
In the context of an airgap Palette or VerteX installation, you must remove the grafana-piechart-panel plugin. This
plugin is not included by default and requires an internet connection to download. The monitoring stack doesn't require
this plugin to function properly.
charts:
  kube-prometheus-stack:
    grafana:
      plugins:
        - grafana-piechart-panel
Email Alerts
You can configure the Prometheus server to send email alerts to a set of contacts. Toggle the Email Alerts button to
enable email alerting. Update the alertmanager.config.receivers settings with all the required email setting values.
charts:
  kube-prometheus-stack:
    alertmanager:
      config:
        receivers:
          - name: email-alert
            email_configs:
              - to: <reciever>@<domainname>.com
                send_resolved: true
                from: <sender>@<domainname>.com
                smarthost: smtp.<domainname>.com:587
                auth_username: <sender>@<domainname>.com
                auth_identity: <sender>@<domainname>.com
                auth_password: <sender_passwd>
Refer to the Prometheus Alertmanager Configuration documentation to learn more about Alertmanager.
Grafana Ingress
You can enable an ingress endpoint for Grafana that will deploy an NGINX ingress controller. This feature can be used to enable HTTPS and require authentication for all Prometheus API requests.
If you do not enable the ingress option, then by default a service with a load balancer will be created that exposes port 80.
Toggle the Enable button to enable the use of Ingress.
Thanos SideCar
Thanos is an open-source system for running large-scale, distributed, and highly available Prometheus setups. Thanos allows Prometheus to store data for extended periods in object storage, such as Amazon S3 or Google Cloud Storage, instead of a local disk. This enables Prometheus to scale horizontally without the risk of using up local storage space.
Toggle the Enable button to enable the use of Thanos.
Object Store
Select the Thanos object storage type you will use. Review the thanos.objstoreConfig parameters to configure the use
of object storage with Thanos. Refer to the
Thanos Object Storage documentation to learn more about
how to configure each object storage.
charts:
  kube-prometheus-stack:
    prometheus:
      prometheusSpec:
        thanos:
          objstoreConfig:
Thanos Ruler Object Store
By default, Thanos Ruler event data is saved in object storage specified for Thanos, but you can specify a different object storage for event data. Refer to the Thanos Ruler resource to learn more.
Remote Monitoring
You can configure the Prometheus server to accept metrics from Prometheus agents and become a centralized aggregation point for all Kubernetes metrics. Enabling this feature will expose port 9090 of the prometheus-operator-prometheus service. Use the generated service URL to provide other Kubernetes clusters with the installed Prometheus Agent so that cluster metrics can be forwarded to the Prometheus server.
The remote monitoring feature is configured with defaults to help you consume this feature out-of-the-box. You can change any configuration related to remote monitoring to fine-tune settings for your environment.
Refer to the Prometheus Remote Write Tuning resource to learn more about configuration options.
To get started with remote monitoring, check out the Deploy Monitoring Stack guide.
Palette Resources Monitoring
You can access internal Palette metrics in Grafana by adding the Prometheus Cluster Metrics pack to all your client clusters. Refer to the Enable Monitoring on Host Cluster guide to learn more.
Persistent Storage
You can configure the Prometheus Operator to use persistent storage. To enable persistent storage add the following code
snippet to the kube-prometheus-stack.prometheus.prometheusSpec.storageSpec configuration block in the pack's YAML
configuration file. The code snippet below creates a Persistent Volume Claim (PVC) for the Prometheus Operator.
kube-prometheus-stack:
  prometheus:
    prometheusSpec:
      storageSpec:
        volumeClaimTemplate:
          metadata:
            name: prom-operator-pvc
          spec:
            storageClassName: spectro-storage-class
            accessModes: ["ReadWriteOnce"]
            resources:
              requests:
                storage: 5Gi
Dependencies
The Prometheus Operator pack installs the following dependencies:
-
Service monitors to scrape internal Kubernetes components
Prerequisites
-
Kubernetes v1.16 or greater.
-
The minimum required size for the Prometheus server is 4 CPU, 8 GB Memory, and 10 GB Storage. We recommend the monitoring stack have 1.5x to 2x the minimum required size:
Recommended size:
- 8 CPU
- 16 GB Memory
- 20 GB Storage
As new clusters with the Prometheus agent are added to your environment, review the resource utilization and consider increasing resources if needed. As the Prometheus documentation recommends, each additional agent requires the following resources from the monitoring stack:
Each added agent:
- 0.1 CPU
- 250 MiB Memory
- 1 GB Storage
Refer to the Prometheus Operational aspects documentation for additional guidance.
Parameters
The Prometheus operator supports all the parameters exposed by the kube-prometheus-stack Helm Chart. Refer to the kube-prometheus-stack documentation for details.
The Prometheus Operator pack has one parameter you must initialize grafana.adminPassword:
charts:
  kube-prometheus-stack:
    grafana:
      adminPassword: ""
Use the grafana.adminPassword parameter to assign a password to the Grafana admin user admin.
Additional parameters you should be aware of can be found by expanding the Presets options. You can modify the preset settings when you create the profile or when you deploy the cluster and review the cluster profile.

Review the usage section below to learn more about each preset option.
Usage
Check out the guide Deploy Monitoring Stack to learn how to create a monitoring stack with Prometheus for your Palette environment.
Airgap Palette and VerteX
In the context of an airgap Palette or VerteX installation, you must remove the grafana-piechart-panel plugin. This
plugin is not included by default and requires an internet connection to download. The monitoring stack doesn't require
this plugin to function properly.
charts:
  kube-prometheus-stack:
    grafana:
      plugins:
        - grafana-piechart-panel
Email Alerts
You can configure the Prometheus server to send email alerts to a set of contacts. Toggle the Email Alerts button to
enable email alerting. Update the alertmanager.config.receivers settings with all the required email setting values.
charts:
  kube-prometheus-stack:
    alertmanager:
      config:
        receivers:
          - name: email-alert
            email_configs:
              - to: <reciever>@<domainname>.com
                send_resolved: true
                from: <sender>@<domainname>.com
                smarthost: smtp.<domainname>.com:587
                auth_username: <sender>@<domainname>.com
                auth_identity: <sender>@<domainname>.com
                auth_password: <sender_passwd>
Refer to the Prometheus Alertmanager Configuration documentation to learn more about Alertmanager.
Grafana Ingress
You can enable an ingress endpoint for Grafana that will deploy an NGINX ingress controller. This feature can be used to enable HTTPS and require authentication for all Prometheus API requests.
If you do not enable the ingress option, then by default a service with a load balancer will be created that exposes port 80.
Toggle the Enable button to enable the use of Ingress.
Thanos SideCar
Thanos is an open-source system for running large-scale, distributed, and highly available Prometheus setups. Thanos allows Prometheus to store data for extended periods in object storage, such as Amazon S3 or Google Cloud Storage, instead of a local disk. This enables Prometheus to scale horizontally without the risk of using up local storage space.
Toggle the Enable button to enable the use of Thanos.
Object Store
Select the Thanos object storage type you will use. Review the thanos.objstoreConfig parameters to configure the use
of object storage with Thanos. Refer to the
Thanos Object Storage documentation to learn more about
how to configure each object storage.
charts:
  kube-prometheus-stack:
    prometheus:
      prometheusSpec:
        thanos:
          objstoreConfig:
Thanos Ruler Object Store
By default, Thanos Ruler event data is saved in object storage specified for Thanos, but you can specify a different object storage for event data. Refer to the Thanos Ruler resource to learn more.
Remote Monitoring
You can configure the Prometheus server to accept metrics from Prometheus agents and become a centralized aggregation point for all Kubernetes metrics. Enabling this feature will expose port 9090 of the prometheus-operator-prometheus service. Use the generated service URL to provide other Kubernetes clusters with the installed Prometheus Agent so that cluster metrics can be forwarded to the Prometheus server.
The remote monitoring feature is configured with defaults to help you consume this feature out-of-the-box. You can change any configuration related to remote monitoring to fine-tune settings for your environment.
Refer to the Prometheus Remote Write Tuning resource to learn more about configuration options.
To get started with remote monitoring, check out the Deploy Monitoring Stack guide.
Palette Resources Monitoring
You can access internal Palette metrics in Grafana by adding the Prometheus Cluster Metrics pack to all your client clusters. Refer to the Enable Monitoring on Host Cluster guide to learn more.
Persistent Storage
You can configure the Prometheus Operator to use persistent storage. To enable persistent storage, add the following
code snippet to the kube-prometheus-stack.prometheus.prometheusSpec.storageSpec configuration block in the pack's YAML
configuration file. The code snippet below creates a Persistent Volume Claim (PVC) for the Prometheus Operator.
kube-prometheus-stack:
  prometheus:
    prometheusSpec:
      storageSpec:
        volumeClaimTemplate:
          metadata:
            name: prom-operator-pvc
          spec:
            storageClassName: spectro-storage-class
            accessModes: ["ReadWriteOnce"]
            resources:
              requests:
                storage: 5Gi
Dependencies
The Prometheus Operator pack installs the following dependencies:
-
Service monitors to scrape internal Kubernetes components
Prerequisites
-
Kubernetes v1.16 or greater.
-
The minimum required size for the Prometheus server is 4 CPU, 8 GB Memory, and 10 GB Storage. We recommend the monitoring stack have 1.5x to 2x the minimum required size:
Recommended size:
- 8 CPU
- 16 GB Memory
- 20 GB Storage
As new clusters with the Prometheus agent are added to your environment, review the resource utilization and consider increasing resources if needed. As the Prometheus documentation recommends, each additional agent requires the following resources from the monitoring stack:
Each added agent:
- 0.1 CPU
- 250 MiB Memory
- 1 GB Storage
Refer to the Prometheus Operational aspects documentation for additional guidance.
Parameters
The Prometheus operator supports all the parameters exposed by the kube-prometheus-stack Helm Chart. Refer to the kube-prometheus-stack documentation for details.
The Prometheus Operator pack has one parameter you must initialize grafana.adminPassword:
charts:
  kube-prometheus-stack:
    grafana:
      adminPassword: ""
Use the grafana.adminPassword parameter to assign a password to the Grafana admin user admin.
Additional parameters you should be aware of can be found by expanding the Presets options. You can modify the preset settings when you create the profile or when you deploy the cluster and review the cluster profile.

Review the usage section below to learn more about each preset option.
Usage
Check out the guide Deploy Monitoring Stack to learn how to create a monitoring stack with Prometheus for your Palette environment.
Email Alerts
You can configure the Prometheus server to send email alerts to a set of contacts. Toggle the Email Alerts button to
enable email alerting. Update the alertmanager.config.receivers settings with all the required email setting values.
charts:
  kube-prometheus-stack:
    alertmanager:
      config:
        receivers:
          - name: email-alert
            email_configs:
              - to: <reciever>@<domainname>.com
                send_resolved: true
                from: <sender>@<domainname>.com
                smarthost: smtp.<domainname>.com:587
                auth_username: <sender>@<domainname>.com
                auth_identity: <sender>@<domainname>.com
                auth_password: <sender_passwd>
Refer to the Prometheus Alertmanager Configuration documentation to learn more about Alertmanager.
Grafana Ingress
You can enable an ingress endpoint for Grafana that will deploy an NGINX ingress controller. This feature can be used to enable HTTPS and require authentication for all Prometheus API requests.
If you do not enable the ingress option, then by default a service with a load balancer will be created that exposes port 80.
Toggle the Enable button to enable the use of Ingress.
Thanos SideCar
Thanos is an open-source system for running large-scale, distributed, and highly available Prometheus setups. Thanos allows Prometheus to store data for extended periods in object storage, such as Amazon S3 or Google Cloud Storage, instead of a local disk. This enables Prometheus to scale horizontally without the risk of using up local storage space.
Toggle the Enable button to enable the use of Thanos.
Object Store
Select the Thanos object storage type you will use. Review the thanos.objstoreConfig parameters to configure the use
of object storage with Thanos. Refer to the
Thanos Object Storage documentation to learn more about
how to configure each object storage.
charts:
  kube-prometheus-stack:
    prometheus:
      prometheusSpec:
        thanos:
          objstoreConfig:
Thanos Ruler Object Store
By default, Thanos Ruler event data is saved in object storage specified for Thanos, but you can specify a different object storage for event data. Refer to the Thanos Ruler resource to learn more.
Remote Monitoring
You can configure the Prometheus server to accept metrics from Prometheus agents and become a centralized aggregation point for all Kubernetes metrics. Enabling this feature will expose port 9090 of the prometheus-operator-prometheus service. Use the generated service URL to provide other Kubernetes clusters with the installed Prometheus Agent so that cluster metrics can be forwarded to the Prometheus server.
The remote monitoring feature is configured with defaults to help you consume this feature out-of-the-box. You can change any configuration related to remote monitoring to fine-tune settings for your environment.
Refer to the Prometheus Remote Write Tuning resource to learn more about configuration options.
To get started with remote monitoring, check out the Deploy Monitoring Stack guide.
Palette Resources Monitoring
You can access internal Palette metrics in Grafana by adding the Prometheus Cluster Metrics pack to all your client clusters. Refer to the Enable Monitoring on Host Cluster guide to learn more.
Persistent Storage
You can configure the Prometheus Operator to use persistent storage. To enable persistent storage add the following code
snippet to the kube-prometheus-stack.prometheus.prometheusSpec.storageSpec configuration block in the pack's YAML
configuration file. The code snippet below creates a Persistent Volume Claim (PVC) for the Prometheus Operator.
kube-prometheus-stack:
  prometheus:
    prometheusSpec:
      storageSpec:
        volumeClaimTemplate:
          metadata:
            name: prom-operator-pvc
          spec:
            storageClassName: spectro-storage-class
            accessModes: ["ReadWriteOnce"]
            resources:
              requests:
                storage: 5Gi
Dependencies
The Prometheus Operator pack installs the following dependencies:
-
Service monitors to scrape internal Kubernetes components
Prerequisites
-
Kubernetes v1.16 or greater.
-
The minimum required size for the Prometheus server is 4 CPU, 8 GB Memory, and 10 GB Storage. We recommend the monitoring stack have 1.5x to 2x the minimum required size:
Recommended size:
- 8 CPU
- 16 GB Memory
- 20 GB Storage
As new clusters with the Prometheus agent are added to your environment, review the resource utilization and consider increasing resources if needed. As the Prometheus documentation recommends, each additional agent requires the following resources from the monitoring stack:
Each added agent:
- 0.1 CPU
- 250 MiB Memory
- 1 GB Storage
Refer to the Prometheus Operational aspects documentation for additional guidance.
Parameters
The Prometheus operator supports all the parameters exposed by the kube-prometheus-stack Helm Chart. Refer to the kube-prometheus-stack documentation for details.
The Prometheus Operator pack has one parameter you must initialize grafana.adminPassword:
charts:
  kube-prometheus-stack:
    grafana:
      adminPassword: ""
Use the grafana.adminPassword parameter to assign a password to the Grafana admin user admin.
Additional parameters you should be aware of can be found by expanding the Presets options. You can modify the preset settings when you create the profile or when you deploy the cluster and review the cluster profile.

Review the usage section below to learn more about each preset option.
Usage
Check out the guide Deploy Monitoring Stack to learn how to create a monitoring stack with Prometheus for your Palette environment.
Email Alerts
You can configure the Prometheus server to send email alerts to a set of contacts. Toggle the Email Alerts button to
enable email alerting. Update the alertmanager.config.receivers settings with all the required email setting values.
charts:
  kube-prometheus-stack:
    alertmanager:
      config:
        receivers:
          - name: email-alert
            email_configs:
              - to: <reciever>@<domainname>.com
                send_resolved: true
                from: <sender>@<domainname>.com
                smarthost: smtp.<domainname>.com:587
                auth_username: <sender>@<domainname>.com
                auth_identity: <sender>@<domainname>.com
                auth_password: <sender_passwd>
Refer to the Prometheus Alertmanager Configuration documentation to learn more about Alertmanager.
Grafana Ingress
You can enable an ingress endpoint for Grafana that will deploy an NGINX ingress controller. This feature can be used to enable HTTPS and require authentication for all Prometheus API requests.
If you do not enable the ingress option, then by default a service with a load balancer will be created that exposes port 80.
Toggle the Enable button to enable the use of Ingress.
Thanos SideCar
Thanos is an open-source system for running large-scale, distributed, and highly available Prometheus setups. Thanos allows Prometheus to store data for extended periods in object storage, such as Amazon S3 or Google Cloud Storage, instead of a local disk. This enables Prometheus to scale horizontally without the risk of using up local storage space.
Toggle the Enable button to enable the use of Thanos.
Object Store
Select the Thanos object storage type you will use. Review the thanos.objstoreConfig parameters to configure the use
of object storage with Thanos. Refer to the
Thanos Object Storage documentation to learn more about
how to configure each object storage.
charts:
  kube-prometheus-stack:
    prometheus:
      prometheusSpec:
        thanos:
          objstoreConfig:
Thanos Ruler Object Store
By default, Thanos Ruler event data is saved in object storage specified for Thanos, but you can specify a different object storage for event data. Refer to the Thanos Ruler resource to learn more.
Remote Monitoring
You can configure the Prometheus server to accept metrics from Prometheus agents and become a centralized aggregation point for all Kubernetes metrics. Enabling this feature will expose port 9090 of the prometheus-operator-prometheus service. Use the generated service URL to provide other Kubernetes clusters with the installed Prometheus Agent so that cluster metrics can be forwarded to the Prometheus server.
The remote monitoring feature is configured with defaults to help you consume this feature out-of-the-box. You can change any configuration related to remote monitoring to fine-tune settings for your environment.
Refer to the Prometheus Remote Write Tuning resource to learn more about configuration options.
To get started with remote monitoring, check out the Deploy Monitoring Stack guide.
Palette Resources Monitoring
You can access internal Palette metrics in Grafana by adding the Prometheus Cluster Metrics pack to all your client clusters. Refer to the Enable Monitoring on Host Cluster guide to learn more.
Dependencies
The Prometheus Operator pack installs the following dependencies:
-
Service monitors to scrape internal Kubernetes components
Prerequisites
-
Kubernetes v1.16 or greater.
-
The minimum required size for the Prometheus server is 4 CPU, 8 GB Memory, and 10 GB Storage. We recommend the monitoring stack have 1.5x to 2x the minimum required size:
Recommended size:
- 8 CPU
- 16 GB Memory
- 20 GB Storage.
As new clusters with the Prometheus agent are added to your environment, review the resource utilization and consider increasing resources if needed. As the Prometheus documentation recommends, each additional agent requires the following resources from the monitoring stack:
Each added agent:
- 0.1 CPU
- 250 MiB Memory
- 1 GB Storage.
Refer to the Prometheus Operational aspects documentation for additional guidance.
Parameters
The Prometheus operator supports all the parameters exposed by the kube-prometheus-stack Helm Chart. Refer to the kube-prometheus-stack documentation for details.
The Prometheus Operator pack has one parameter you must initialize grafana.adminPassword:
charts:
  kube-prometheus-stack:
    grafana:
      adminPassword: ""
Use the grafana.adminPassword parameter to assign a password to the Grafana admin user admin.
Additional parameters you should be aware of can be found by expanding the Presets options. You can modify the preset settings when you create the profile or when you deploy the cluster and review the cluster profile.

Review the usage section below to learn more about each preset option.
Usage
Check out the guide Deploy Monitoring Stack to learn how to create a monitoring stack with Prometheus for your Palette environment.
Email Alerts
You can configure the Prometheus server to send email alerts to a set of contacts. Toggle the Email Alerts button to
enable email alerting. Update the alertmanager.config.receivers settings with all the required email setting values.
charts:
  kube-prometheus-stack:
    alertmanager:
      config:
        receivers:
          - name: email-alert
            email_configs:
              - to: <reciever>@<domainname>.com
                send_resolved: true
                from: <sender>@<domainname>.com
                smarthost: smtp.<domainname>.com:587
                auth_username: <sender>@<domainname>.com
                auth_identity: <sender>@<domainname>.com
                auth_password: <sender_passwd>
Refer to the Prometheus Alertmanager Configuration documentation to learn more about Alertmanager.
Grafana Ingress
You can enable an ingress endpoint for Grafana that will deploy an NGINX ingress controller. This feature can be used to enable HTTPS and require authentication for all Prometheus API requests.
If you do not enable the ingress option, then by default a service with a load balancer will be created that exposes port 80.
Toggle the Enable button to enable the use of Ingress.
Thanos SideCar
Thanos is an open-source system for running large-scale, distributed, and highly available Prometheus setups. Thanos allows Prometheus to store data for extended periods in object storage, such as Amazon S3 or Google Cloud Storage, instead of a local disk. This enables Prometheus to scale horizontally without the risk of using up local storage space.
Toggle the Enable button to enable the use of Thanos.
Object Store
Select the Thanos object storage type you will use. Review the thanos.objstoreConfig parameters to configure the use
of object storage with Thanos. Refer to the
Thanos Object Storage documentation to learn more about
how to configure each object storage.
charts:
  kube-prometheus-stack:
    prometheus:
      prometheusSpec:
        thanos:
          objstoreConfig:
Thanos Ruler Object Store
By default, Thanos Ruler event data is saved in object storage specified for Thanos, but you can specify a different object storage for event data. Refer to the Thanos Ruler resource to learn more.
Remote Monitoring
You can configure the Prometheus server to accept metrics from Prometheus agents and become a centralized aggregation point for all Kubernetes metrics. Enabling this feature will expose port 9090 of the prometheus-operator-prometheus service. Use the generated service URL to provide other Kubernetes clusters with the Prometheus Agent installed so that cluster metrics can be forwarded to the Prometheus server.
The remote monitoring feature is configured with defaults to help you consume this feature out-of-the-box. You can change any configuration related to remote monitoring to fine-tune settings for your environment.
Refer to the Prometheus Remote Write resource to learn more about configuration options.
To get started with remote monitoring, check out the Deploy Monitoring Stack guide.
Dependencies
The Prometheus Operator pack installs the following dependencies:
- Prometheus Operator GitHub
- Prometheus
- Prometheus Alertmanager.
- node-exporter
- kube-state-metrics
- Grafana
- and the service monitors to scrape internal Kubernetes components.
Prerequisites
- Kubernetes v1.16 or greater.
Parameters
The Prometheus operator supports all the parameters exposed by the kube-prometheus-stack Helm Chart. Refer to the kube-prometheus-stack documentation for details.
The Prometheus Operator pack has one parameter you must initialize grafana.adminPassword:
charts:
  kube-prometheus-stack:
    grafana:
      adminPassword: ""
Use the grafana.adminPassword parameter to assign a password to the Grafana admin user admin.
Additional parameters you should be aware of can be found by expanding the Presets options. You can modify the preset settings when you create the profile or when you deploy the cluster and review the cluster profile.

Review the usage section below to learn more about each preset option.
Email Alerts
You can configure the Prometheus server to send email alerts to a set of contacts. Toggle the Email Alerts button to
enable email alerting. Update the alertmanager.config.receivers settings with all the required email setting values.
charts:
  kube-prometheus-stack:
    alertmanager:
      config:
        receivers:
          - name: email-alert
            email_configs:
              - to: <reciever>@<domainname>.com
                send_resolved: true
                from: <sender>@<domainname>.com
                smarthost: smtp.<domainname>.com:587
                auth_username: <sender>@<domainname>.com
                auth_identity: <sender>@<domainname>.com
                auth_password: <sender_passwd>
Refer to the Prometheus Alertmanager Configuration documentation to learn more about Alertmanager.
Grafana Ingress
You can enable an ingress endpoint for Grafana that will deploy an NGINX ingress controller. This feature can be used to enable HTTPS and require authentication for all Prometheus API requests.
If you do not enable the ingress option, by default a service with a load balancer will be created that exposes port 80.
Toggle the Enable button to enable the use of Ingress.
Thanos SideCar
Thanos is an open-source system for running large-scale, distributed, and highly available Prometheus setups. Thanos allows Prometheus to store data for extended periods in object storage, such as Amazon S3 or Google Cloud Storage, instead of a local disk. This enables Prometheus to scale horizontally without the risk of using up local storage space.
Toggle the Enable button to enable the use of Thanos.
Object Store
Select the Thanos object storage type you will use. Review the thanos.objstoreConfig parameters to configure the use
of object storage with Thanos. Refer to the
Thanos Object Storage documentation to learn more about
how to configure each object storage.
charts:
  kube-prometheus-stack:
    prometheus:
      prometheusSpec:
        thanos:
          objstoreConfig:
Thanos Ruler Object Store
You can specify a different object storage to store the Thanos Ruler event data. Defaults to the object storage specified for Thanos. Refer to the Thanos Ruler resource to learn more.
Dependencies
The Prometheus Operator pack installs the following dependencies:
- Prometheus Operator GitHub
- Prometheus
- Prometheus Alertmanager.
- node-exporter
- kube-state-metrics
- Grafana
- and the service monitors to scrape internal Kubernetes components.
Prerequisites
- Kubernetes v1.16 or greater.
Parameters
The Prometheus operator supports all the parameters exposed by the kube-prometheus-stack Helm Chart. Refer to the kube-prometheus-stack documentation for details.
The Prometheus Operator pack has one parameter you must initialize grafana.adminPassword:
charts:
  kube-prometheus-stack:
    grafana:
      adminPassword: ""
Use the grafana.adminPassword parameter to assign a password to the Grafana admin user admin.
Additional parameters you should be aware of can be found by expanding the Presets view of the pack. You can modify
the preset settings during the profile creation process or the cluster deployment process when reviewing the cluster
profile.

Review the usage section below to learn more about each preset option.
Email Alerts
You can configure the Prometheus server to send email alerts to a set of contacts. Toggle the Email Alerts button to
enable email alerting. Update the alertmanager.config.receivers settings with all the required email setting values.
charts:
  kube-prometheus-stack:
    alertmanager:
      config:
        receivers:
          - name: email-alert
            email_configs:
              - to: <reciever>@<domainname>.com
                send_resolved: true
                from: <sender>@<domainname>.com
                smarthost: smtp.<domainname>.com:587
                auth_username: <sender>@<domainname>.com
                auth_identity: <sender>@<domainname>.com
                auth_password: <sender_passwd>
Refer to the Prometheus Alertmanager Configuration documentation to learn more about Alertmanager.
Grafana Ingress
You can enable an ingress endpoint for Grafana that will deploy an NGINX ingress controller. This feature can be used to enable HTTPS and require authentication for all Prometheus API requests.
If you do not enable the ingress option, then by default a service with a load balancer will be created that exposes port 80.
Toggle the Enable button to enable the use of Ingress.
Thanos SideCar
Thanos is an open-source system for running large-scale, distributed, and highly available Prometheus setups. Thanos allows Prometheus to store data for extended periods in object storage, such as Amazon S3 or Google Cloud Storage, instead of a local disk. This enables Prometheus to scale horizontally without the risk of using up local storage space.
Toggle the Enable button to enable the use of Thanos.
Object Store
Select the Thanos object storage type you will use. Review the thanos.objstoreConfig parameters to configure the use
of object storage with Thanos. Refer to the
Thanos Object Storage documentation to learn more about
how to configure each object storage.
charts:
  kube-prometheus-stack:
    prometheus:
      prometheusSpec:
        thanos:
          objstoreConfig:
Thanos Ruler Object Store
You can specify a different object storage to store the Thanos Ruler event data. Defaults to the object storage specified for Thanos. Refer to the Thanos Ruler resource to learn more.
Dependencies
The Prometheus Operator pack installs the following dependencies:
- Prometheus Operator GitHub
- Prometheus
- Prometheus Alertmanager.
- node-exporter
- kube-state-metrics
- Grafana
- and the service monitors to scrape internal Kubernetes components.
Prerequisites
- Kubernetes v1.16 or greater.
Parameters
The Prometheus operator supports all the parameters exposed by the kube-prometheus-stack Helm Chart. Refer to the kube-prometheus-stack documentation for details.
The Prometheus Operator pack has one parameter you must initialize grafana.adminPassword:
charts:
  kube-prometheus-stack:
    grafana:
      adminPassword: ""
Use the grafana.adminPassword parameter to assign a password to the Grafana admin user admin.
Additional parameters you should be aware of can be found by expanding the Presets options. You can modify the preset settings when you create the profile or when you deploy the cluster and review the cluster profile.

Review the usage section below to learn more about each preset option.
Email Alerts
You can configure the Prometheus server to send email alerts to a set of contacts. Toggle the Email Alerts button to
enable email alerting. Update the alertmanager.config.receivers settings with all the required email setting values.
charts:
  kube-prometheus-stack:
    alertmanager:
      config:
        receivers:
          - name: email-alert
            email_configs:
              - to: <reciever>@<domainname>.com
                send_resolved: true
                from: <sender>@<domainname>.com
                smarthost: smtp.<domainname>.com:587
                auth_username: <sender>@<domainname>.com
                auth_identity: <sender>@<domainname>.com
                auth_password: <sender_passwd>
Refer to the Prometheus Alertmanager Configuration documentation to learn more about Alertmanager.
Grafana Ingress
You can enable an ingress endpoint for Grafana that will deploy an NGINX ingress controller. This feature can be used to enable HTTPS and require authentication for all Prometheus API requests.
If you do not enable the ingress option, then by default a service with a load balancer will be created that exposes port 80.
Toggle the Enable button to enable the use of Ingress.
Thanos SideCar
Thanos is an open-source system for running large-scale, distributed, and highly available Prometheus setups. Thanos allows Prometheus to store data for extended periods in object storage, such as Amazon S3 or Google Cloud Storage, instead of a local disk. This enables Prometheus to scale horizontally without the risk of using up local storage space.
Toggle the Enable button to enable the use of Thanos.
Object Store
Select the Thanos object storage type you will use. Review the thanos.objstoreConfig parameters to configure the use
of object storage with Thanos. Refer to the
Thanos Object Storage documentation to learn more about
how to configure each object storage.
charts:
  kube-prometheus-stack:
    prometheus:
      prometheusSpec:
        thanos:
          objstoreConfig:
Dependencies
The Prometheus Operator pack installs the following dependencies:
- Prometheus Operator GitHub
- Prometheus
- Prometheus Alertmanager.
- node-exporter
- kube-state-metrics
- Grafana
- and the service monitors to scrape internal Kubernetes components.
Prerequisites
- Kubernetes v1.16 or greater.
Parameters
The Prometheus operator supports all the parameters exposed by the kube-prometheus-stack Helm Chart. Refer to the kube-prometheus-stack documentation for details.
The Prometheus Operator pack has one parameter you must initialize grafana.adminPassword:
charts:
  kube-prometheus-stack:
    grafana:
      adminPassword: ""
Use the grafana.adminPassword parameter to assign a password to the Grafana admin user admin.
Additional parameters you should be aware can be found by expanding the Presets options. You can modify the preset settings when you create the profile creation or when you deploy the cluster and review the cluster profile.

Review the usage section below to learn more about each preset option.
Email Alerts
You can configure the Prometheus server to send email alerts to a set of contacts. Toggle the Email Alerts button to
enable email alerting. Update the alertmanager.config.receivers settings with all the required email setting values.
charts:
  kube-prometheus-stack:
    alertmanager:
      config:
        receivers:
          - name: email-alert
            email_configs:
              - to: <reciever>@<domainname>.com
                send_resolved: true
                from: <sender>@<domainname>.com
                smarthost: smtp.<domainname>.com:587
                auth_username: <sender>@<domainname>.com
                auth_identity: <sender>@<domainname>.com
                auth_password: <sender_passwd>
Refer to the Prometheus Alertmanager Configuration documentation to learn more about Alertmanager.
Grafana Ingress
You can enable an ingress endpoint for Grafana that will deploy an NGINX ingress controller. This feature can be used to enable HTTPS and require authentication for all Prometheus API requests.
If you do not enable the ingress option, then by default a service with a load balancer will be created that exposes port 80.
Toggle the Enable button to enable the use of Ingress.
Dependencies
The Prometheus Operator pack installs the following dependencies:
- Prometheus Operator GitHub
- Prometheus
- Prometheus Alertmanager.
- node-exporter
- kube-state-metrics
- Grafana
- and the service monitors to scrape internal Kubernetes components.
All versions less than v30.2.X are considered deprecated. Upgrade to a newer version to take advantage of new features.
Terraform
You can retrieve details about the Prometheus operator pack by using the following Terraform code.
data "spectrocloud_registry" "public_registry" {
  name = "Public Repo"
}

data "spectrocloud_pack_simple" "pack-info" {
  name         = "prometheus-opeartor"
  version      = "45.4.0"
  type         = "helm"
  registry_uid = data.spectrocloud_registry.public_registry.id
}